Begin the "Define" section by reflecting on what you know and want to know about this "Thing."
Assessment is taking place all the time. We assess our students, the workplace, entertainment and art, food in restaurants, transportation and much more. Assessment should be looked at as a learning experience, so that there is constant improvement. In this "Thing," you will learn about the resources for assessment data collection and analysis at the classroom level.
Learning Objectives
Click on each title below to see detailed information.
Overview of Assessment
Teachers need to know the tools available to create an online assessment experience, so that students are receiving quick feedback, tracking progress and improving performance. They also need to know the resources available to them at both the local, state and national levels for demographic data. As you proceed through this "Thing", keep these ideas in mind.
Using Data to Inform Instruction
The use of evaluation and assessment tools to improve student achievement has become a best practice and integral part of collecting demographic, achievement, process, and perception data. The data gathered is therefore very important in driving the educational process and helps teachers create relevant lessons.
These online assessment tools and resources provide students the needed experiences in the classroom that replicate some online testing environments, as well as allow teachers the opportunity to collect data and inform instruction. A basic understanding of formative and summative assessments of learning is critical!
As you consider online assessment in your own classroom, features like video, multimedia, interactives and online editing tools (the highlighter in Google Docs or Word) are valuable means for educating and assessing. Being aware of assessment resources specific to your school and/or state such as; data warehouses, test items/item banks, and Smarter Balanced or PARCC materials, will also add connections to successful online assessment practices.
Evaluating Technology Tools
Choosing the best technology tool to achieve your learning goals means actively comparing tool features and functionality for use in your classroom. This is especially true when evaluating assessment tools.
One framework to help you evaluate these tools is Liz Kolb's' Triple E Framework. Her rubric to evaluate apps and websites will help you find tools and resources that fit into the goal to improve lessons that extend, enhance, and engage as well as assess.
Another example of a resource for tool evaluation is the Kaizena review which explores functionality, use, and privacy among other features.
You can also evaluate tools or websites with this simple Google Slide. Make a copy of the Tool Evaluation Template and save to your files to keep track of tools you will learn about in the "Thing." Selecting the image will also take you to the file.
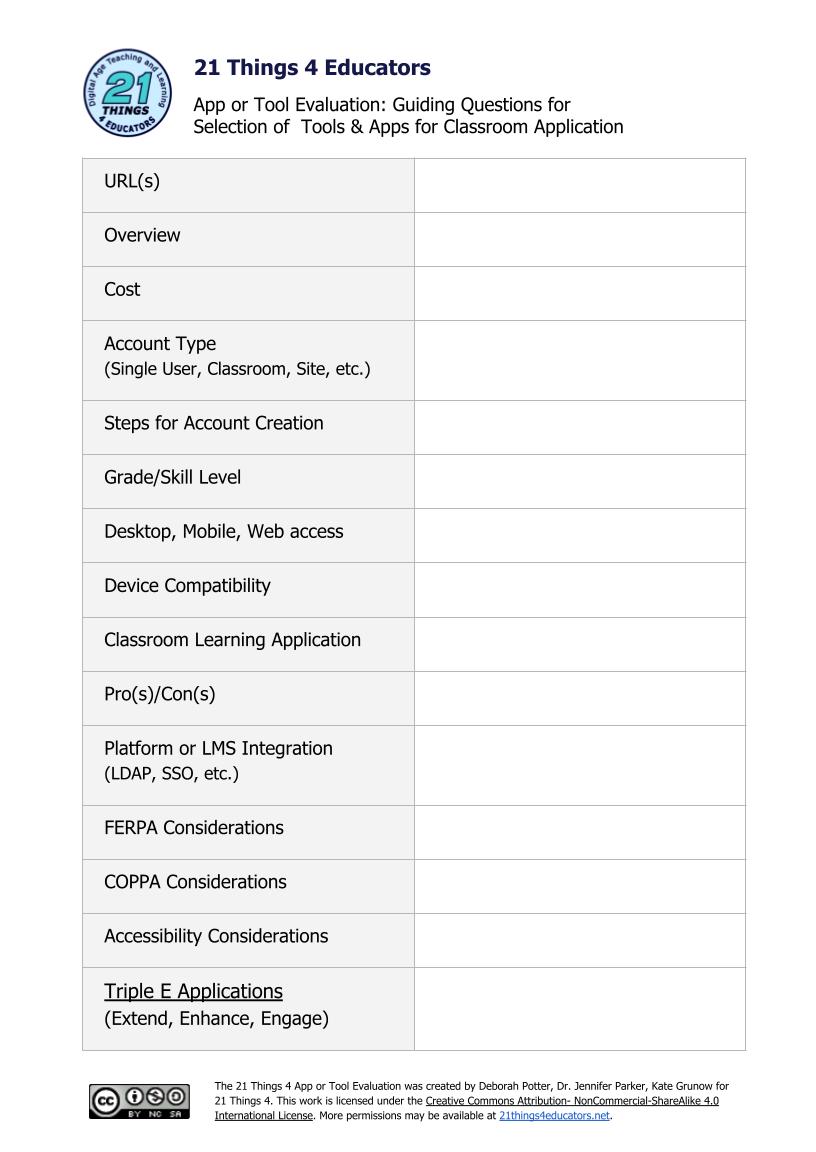
![]()
Now that you have an overview of assessment and have made a copy of the tool evaluation template, move on to the next section - Four Types of Data.
Types of Data Collected in Education
There are four types of data collected in education: demographic, achievement (academics), process, and perception. In most states schools are required to track and report this data as part of their school improvement plan.
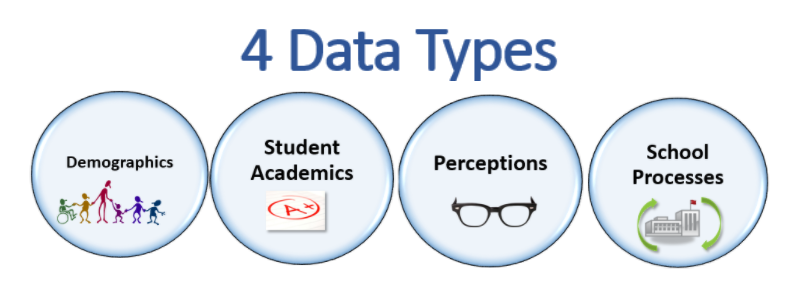
Image source: Lisa Guzzardo Asaro, Facilitators of School Improvement, Macomb ISD
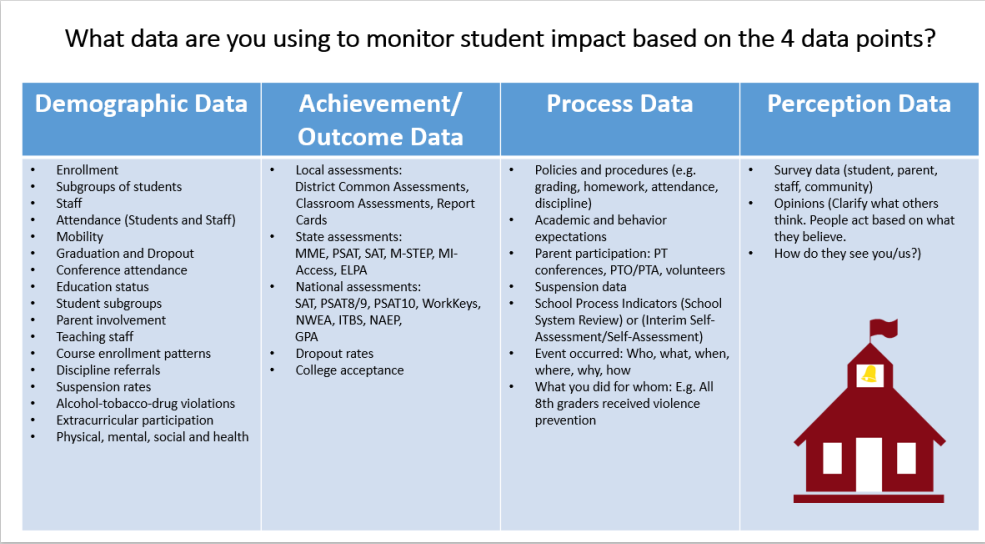
This next infographic lists some examples of what can be collected for each data type.
T3PD: Using Technology for Classroom Data Collection
The T3PD Data Model (Technology+Perception+Performance+Progress Monitoring+Demographic) outlines how technology can improve the data collection process. Below is an infographic of the model and gives you an overview of the 4 options.
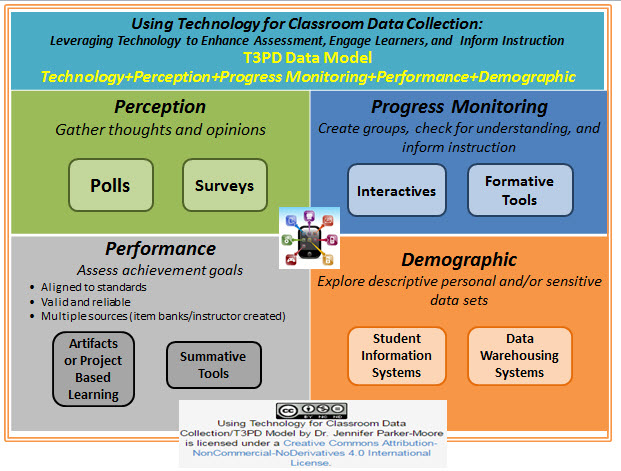
Select the image above to retrieve the document.
![]()
Now that you have an understanding of the four data types, investigate each one further in the following sections. Next Up: Perception Meets Technology.
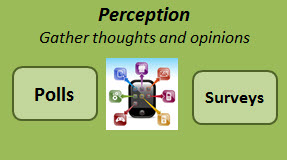
Perception data can be used to inform lesson objectives, and/or identify pre-existing thoughts, opinions, and ideas. Educators often use polls and surveys to explore starting points for learners with a lesson.
Classroom Applications
- Use Poll Everywhere to survey students about school safety.
- Use Microsoft Forms to survey staff about school calendar (Microsoft Forms Guide).
- Use Google Forms to survey parents about technology used at home (Google Forms Guide).
- Create a Personal Learning Profile survey to assess student learning styles, likes/dislikes, skills, activities, and/or interests.
- Add an interactive poll to your presentation with Slido, Mentimeter or Pear Deck.
- Create a quick Word Cloud in AnswerGarden to find out which vocabulary terms students are having trouble with.
Learn How
- Mentimeter: Create a Menti poll for students and administer/share results in your presentation
- Poll Everywhere: View the "how to" video or explore the Instructor's Guide
- Google Forms: Check out the quick start video
- Pear Deck: Watch a quick video
- Answer Garden: Get started with Answer Garden by creating your first cloud poll
![]()
Now that you have an understanding of perception data and the tools used to collect it, move on to the next section - Progress Monitoring Meets Technology.
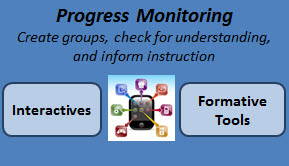
Educators monitor student performance towards goals and objectives, or create groupings for teaching and re-teaching through a variety of formative assessments. Students become more actively engaged with interactive learning, personalized experiences, and the opportunity to chart growth.
Classroom Applications
- Use Quizalize or Quizizz to pre-assess students on their knowledge of causes of the Civil War.
- During a lesson, use Plickers to monitor student learning about today’s lesson on cell division.
- Assign online flashcards in Quizlet or Cram (previously called "Flash Card Exchange) as a test review.
- Create a digital artifact or enhanced video that embeds quiz questions around lesson content with TES Teach, PhotoPeach - or have students create an artifact to demonstrate learning.
- Locate a video, then begin building and enhancing with pauses, embedded questions in a variety of item types, or links to external content with Playposit or EdPuzzle.
- Track student growth over time with GoFormative.
- Utilize Interactives (Thing 12) to engage and encourage learners to track their own progress.
Learn How
- Quizalize: View the how to video on Quizalize, or check out the teacher guide
- Quizizz: Get started with a video
- Kahoot: Check out the teacher guide
- Quizlet: View the video to learn how to create your own flashcards, or use others already posted to the site.
- Plickers: Watch a quick start video
- Blendspace: Explore the getting started and/or demo videos
- PhotoPeach: Learn to embed quiz questions in a digital story in this demo
- Playposit: Navigation Topics
- Teachem: Review article and quick links for additional features
- GoFormative: View the demos on the site.
![]()
Now that you have an understanding of progress monitoring data and the tools used to collect it, move on to the next section - Performance Meets Technology.
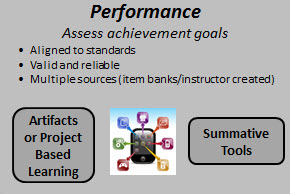
Achievement data comes in many shapes and forms, with summative data being graded and purposeful. When gathering Performance data, educators seek to replicate online high-stakes testing experiences through a variety of technology enhanced item types. Students are asked to create or review digital artifacts, complete Capstone assignments, or experience online tests aligned to standards.
Classroom Applications
- Create a self-grading test using Flubaroo add on, or turn your Google Form into an assessment.
- Create a Rubric using Rubistar, iRubric, Rubric Maker, to establish performance criteria for a project.
- Create an online assessment with tech enhanced items aligned to standards using Edulastic, Socrative or GoFormative.
- Create digital portfolios using SeeSaw.
- Assess student performance via video responses or discussion with Flipgrid.
- Give feedback on student performance with the Kaizena add on to include text comments,video recording, attaching files, and more.
Learn How
- Google Forms: Turning a Google Form into a self-grading quiz.
- Rubistar: Getting started video
- Edulastic: Get started creating assessments aligned to standards
- SeeSaw: Getting Started videos and help.
- Flipgrid: Overview video
- Kaizena: Review on tool uses, privacy, applications, and more.
![]()
Now that you have an understanding of performance data and the tools used to collect it, move on to the next section - Demographic Meets Technology.
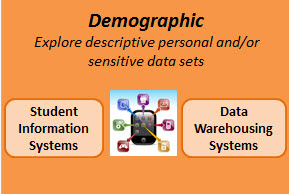
Depending on the data set, often times demographic data exists at an educators fingertips. With FERPA guidelines as our guide, educators should only access student personal information for those rostered to them.
Classroom Applications
- Use the "Save As Doc" add on within Google Sheets to to create a single document for each response.
- Explore demographic information for your geographic area, including socio-economic status, poverty, census, education level, and more with National Center for Education Statistics or U.S. Census Bureau.
- Use your State Data portal (e.g. MISchoolData in Michigan) to explore public information on state testing, student counts, career and college readiness, early childhood, or special education. For example:
- Review student accommodations, subgroups, or special needs populations.
- Check out state trends in graduation/dropout, enrollment, schools of choice, workforce, or postsecondary.
- Visit SchoolDigger or Great Schools to explore achievement and demographic data, as well as other data sets to help evaluate school performance.
- Locate birthdays for a bulletin board or gather parent contact information to solicit parent volunteers in your Student Information System.
Learn How
- Learn to use the Save As Doc add on in Sheets.
- State Data portals: Check out your state's education data portal and what is available to parents, public, and educators depending on role. Here are some examples: MISchoolData, Georgia SLDS Parent Portal, Texas Student Data System, Florida Department of Education Data Systems, Connecticut EdSight, Wisconsin WISEDash. If you use another system from your state, please let us know.
- Local Student Information Systems
- Local Data Warehouses
- Open source solutions for standards based items/test banks like Tao.
This is the last section of "Thing" 19's Define playlist. Now would be a great time to revisit your Reflection Document and think about what you learned in this "Thing." Capture a screenshot of your results from the Knowledge Check and post them in your Reflection Document. As you move forward, consider the following: How might you use this in your own professional practice? What goals might you set for yourself, including activities, timelines, and evaluation? What connections did you make to the ISTE Standards or your own content area standards? How will you monitor your own progress towards these goals? Then proceed to the next section.