Next, review curated resources for teaching and learning in "CONNECT."

MiTechKids Computational Thinker task card for kindergarten. Feeding the birds is fun in many ways. The students can learn bird identification and begin to learn about the bird's habits. The students can use food coloring and color the food in one feeder and see if the birds are more attracted to the food that is more colorful.

MiTechKids Computational Thinker task card for fifth grade. Students are presented with a scenario surrounding a relevant contemporary public issue on which they can take a stand. Students will work together to create a survey that will then be shared with various groups, in order to analyze the ways in which certain groups perceive a given issue. Once collected, the data will be discussed and analyzed. Finally, students will support their opinion using the data collected.

21 Things 4 Students: Thing 13 - Dig the Data. This Thing contains ten Quests. You will learn to create spreadsheets and charts, use formulas, and make decisions based on data. Dig In!

21 Things 4 Students: Thing 21 - Computational Thinking. During this Quest, you will work on these questions and decide whether or not, you need to revisit any of the computational thinking stages.

Make Learning Accessible
From the Department of Education, the Michigan Supports and Accommodations Guidance Document provides an overview of ooptions and requirements for universal tools, designated supports, and accommodations for state summative assessments (M-STEP, MI-Access, WIDA, PSAT, SAT, and ACT WorkKeys).

Support Best Practice
How can you make data analysis part of your everyday routine? You could use a color coding system to match your targets like basic, proficient, advanced. Read this article to learn more. You should also know how to manipulate the data using tools like spreadsheets. Excel for Decision Making and Sort Data in Google Sheets: Different Functions and Sort Types are two resources to help you learn how.
Besides data analysis, digital age assessments need to be written so that they produce reliable data. How do you know that you wrote an assessment question that was good or bad? To find out, read this article: How to Write Good Assessment Questions.
Also, make sure your data includes all learners. The Special Education Data Collection Microsoft's Education Center has information to help you.
You should consider teaching your students to monitor their own grades/progress/achievements. Get Creative: Classroom Tools for Tracking from eSpark and Biblionasium are some tools to try.
Furthermore, evaluation is an important part of the learning process. Check out NWEA's 75 Digital Tools and Apps Teachers Can Use to Support Formative Assessment in the Classroom.
Level Up
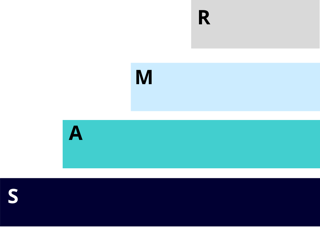
SAMR Framework for Tech Integration
Poll/Survey Example: (Social Studies)
A place you would like to visit- find out more about the culture and climate.
- Substitution - survey about what they know about the country -- taking a paper survey and making it digital
- Augmentation - survey about their knowledge about the country - using cluster bubble sheets for the survey and applying Grade Cam scanner technology
- Modification - Use of clickers to engage in an interactive discussion with multiple questions and engage in dialogue about data trends/findings. (KWL). Share findings in a chart.
- Redefinition - Students begin by setting goals about the lesson. Administer a Pre survey in Excel surveys, then engage in a learning experience/an interactive activity in BlendSpace, then a post-survey in Excel surveys. Ask students to review data trends, reflect on learning and their goals. Include a multi-media presentation that includes the data findings.